
CE-Hub, 2023
CE Hub Digital Series: Extending the Life of Motor Vehicles
CE-Hub, 2024
This article is the third in the CE-Hub’s product lifetime extension (PLE) series and examines the potential of PLE in motor vehicles (a widely owned consumer durable) as a strategic circular economy value driver for delivering a more resource-efficient and sustainable UK mobility system. Be sure to check out the introduction to the PLE series as well as our article on extending the life of consumer electronics.
A ‘circular economy’ (CE) is an economic system organised around the principles of eliminating waste and pollution, keeping materials in use at their highest value for as long as possible and regenerating nature (Ellen Macarthur Foundation). After bringing the current context to life through a series of interactive charts, the article introduces CE strategies that can be applied along the motor vehicle value chain with the potential to boost resource efficiency and resource productivity and generate resource and emissions savings. We then focus in on PLE (including through maintenance and repair, reuse and refurbishment), covering the conditions under which it can generate benefits, tradeoffs to navigate, its potential relative to other CE strategies and place in the wider sustainable mobility hierarchy. Key enablers to PLE in motor vehicles identified include changes in design, business models, purchasing and use practices and government policy. The article lastly describes how the CE-Hub and NICER Programme are working to unlock the value of data to deliver a UK circular economy, including as part of building the UK’s first CE Data Observatory.
Baseline: the UK motor vehicle value chain
Motorised road transport makes up a big part of mobility in the UK today, representing around two-thirds of trips taken and four out of five miles travelled (DfT, 2023). As of June 2023, there were an estimated 41.2 million licensed vehicles across the UK as a whole and approximately 1 car for every 2 people (Figure 1) (ONS, 2022; DfT, 2023).
Figure 1. Registered vehicles by LSOA, England and Wales, Q1 2023 (DfT, 2023)
Domestic transport also currently generates the most greenhouse gas emissions of any ‘Territorial Emissions Statistics’ (TES) sector in the UK, with road travel making up the majority of this (~90%) (DESNZ, 2024). To reduce direct transport emissions, governments across the UK have targeted a significant increase in the sale of low and zero emissions vehicles.[1] Buoyed by new retail and manufacturing business models including personal contract purchases, leasing and subscription services, 2.1 million vehicles (of which, 1.6 million cars) were registered for the first in Great Britain in 2022 (DfT, 2023; Haines-Doran, 2023).
Though petrol and diesel vehicles remain the majority of new registrations at present (Figure 2), a growing share are battery electric vehicles (BEVs) – which have zero tailpipe emissions – and plug in hybrid electric vehicles (PHEVs) and hybrid electric vehicles (HEVs), with significantly lower tailpipe emissions than traditional internal combustion engine vehicles (ICEVs). The shift in drivetrain technologies so far underway and alongside improved fuel efficiency in petrol and diesel vehicles, has contributed to a fairly steep reduction in average tailpipe emissions of new cars sold – down from around 190g CO2/km in 2000 to just over 100g CO2/km in 2022 (SMMT, 2023). While the net effect of this depends also on the emissions intensity of electricity generation – this is declining quite sharply here in the UK too (DESNZ, 2023).
Figure 2. Vehicles registered for the first time by fuel type, Great Britain, 2001 Q1 – 2023 Q1 (CY) (DfT, 2023)
Although motor vehicle manufacturing represents only around 1% of UK gross value added (GVA) (ONS, 2023), it had the second-highest turnover of all UK manufacturing sectors in 2022 (ONS, 2023) while employing around 145,000 people (DBT, 2023) whose wages are approximately a fifth greater than the national median and average (ONS, 2023). Motor vehicles are also the UK’s most valuable exported class of goods, with around 80% of the cars produced domestically exported overseas (ONS, 2023; SMMT, 2023).
Figure 3. Sales of motor vehicles and motor vehicle parts split by 4-digit prodcom code (GBP billion, current prices) (ONS, 2023)
At the same, a large share of new cars purchased in the UK in a given year come from overseas producers (the majority, EU countries), with imports consistently exceeding exports of motor vehicles (under HS4 8703) between 2012 and 2022 (Figure 4) (SMMT, 2023; HMRC, 2023). Approximately a fifth (15%) of UK household expenditure in a given year is taken up by transport,[2] with over 80% of this associated with the purchase of vehicles and operation of private transport[3] (ONS, 2023).
Figure 4. Imports and exports for HS4 8703 (motor cars and motor vehicles principally designed for the transport of persons) across mass, unit and value terms (HMRC, 2023)
Cars today are composed of a variety of materials across the assemblies and components which make them up, ranging from iron and steel, aluminium and metal alloys to rare earth elements, carbon fibre composites, rubber, plastics and textiles. The overall scale of demand for motor vehicles in the UK and their per-unit mass means these represent a significant use of materials in direct terms as well as when accounting for upstream material extraction (Figure 5). This consumption of materials along supply chains also adds to the national carbon footprint (Defra, 2023; Defra, 2023).
Figure 5. Raw material consumption (material footprint) of relevant COICOP categories and carbon footprint for England (varying scales) (Defra, 2023)
Given high import rates and frequently greater environmental intensity of production overseas, a large share of the environmental footprint associated with making motor vehicles purchased in the UK arise beyond the national border. There are nevertheless a range of atmospheric emissions and other environmental impacts which occur along domestic components of the UK vehicle value chain (Figure 6) and including associated with the treatment of 1.5-2 million tonnes of end-of-life (EOL) vehicles in a given year (Defra, 2018; ONS, 2023; DESNZ, 2023).[4]
Figure 6. Atmospheric emissions of domestic activities along the motor vehicle value chain at UK 2-digit SIC code level (DESNZ, 2023; ONS, 2023)[5][6]
Circular economy strategies and UK mobility
The potential upsides of a more circular, resource efficient and productive UK economy include conserving natural capital and reducing carbon emissions, business opportunities for UK firms and improved competitiveness as well as cost savings for households and government (Pearce, 2001; WRAP, 2022; Cambridge Econometrics, 2022).
Circular economy strategies
Getting to a more circular economy in the UK is requiring changes in production, consumption and end-of-life practices across the economy and value chains of goods and services. These often need to be joined up to produce the greatest benefit. We introduce key CE strategies below.
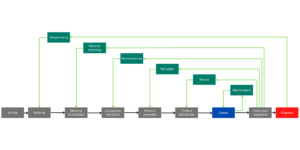
Figure 7. CE-Hub value chain taxonomy (Zils, 2023)
Production-related
- Improved production efficiency and reduced yield loss
- The use of alternative materials
- The greater incorporation of secondary materials
- Product lightweighting
- Changes in design towards greater durability or longevity
Consumption-related
- Product lifetime extension (PLE)
- Use intensification
- Reducing product and material use altogether
End-of-life related
- Improved collection and sorting
- Increased reuse, refurbishment, and remanufacturing
- Greater recycling of materials
The benefits of these strategies can be tested against more linear configurations using metrics including resource efficiency and productivity, carbon emissions and intensity, economic net benefits and increases to GVA and consumer savings. Using a spread of metrics like these can also help explore synergies and tradeoffs between resource efficiency and other benefits such as emissions savings and reduced nature impacts.
CE strategy adoption in the motor vehicle value chain to date
Producers and users of cars in the UK are subject to a range of regulations today including: technical specifications for durability and safety; emissions performance standards; information disclosure requirements on fuel consumption, emissions and product dismantling; fuel taxes, congestion and emissions charges and variable tax rates; plug-in grants for low-emissions vehicles; and producer responsibility requirements for ‘end-of-life’ vehicles with stringent recycling and recovery rates to meet. These, alongside wider price drivers, changes in demand, private investment and R&D have contributed to shifts in the technology and market, and in some cases either directly or indirectly, the greater adoption and performance in relation to those CE strategies or value drivers outlined.
For example, in the UK, reuse and recycling rates for vehicles subject to the End-of-life Vehicles Regulations are currently reported at over 90%. Upstream interventions have been an area of focus for some firms, whether at the R&D or commercialisation stage. A Europe-wide study estimated levels of recycled content entering passenger vehicles to be around 25% (Bain, 2022), while concept cars from 100% recycled content have been developed e.g. the BMW i Vision Circular. Some firms have increasingly used new materials such as high-strength steel and aluminium (Office of Chief Scientist, 2017) to lessen bodyweights while others have integrated design changes for greater upgradeability, including at the level of software (Lyrra and Koskinen, 2018). Some OEMs report having adopted product life extension business models as a means to generate value e.g. Mercedes Benz’ use of longer-lasting materials to extend the service life of vehicle components (Mercedes Benz. 2022). Remanufactured and refurbished parts are widely available on the likes of eBay and can offer consumer savings and reduced material losses versus e.g. recycling (Zhang et al. 2021). Vehicle repair and maintenance activities also already contribute significantly to the UK economy (Figure 9). There is also already a strong resale market for vehicles in the UK, with 4 in 5 consumers in Great Britain reporting being willing to purchase a pre-owned vehicle and used vehicle transactions at over 7 million in 2023 (YouGov, 2023; SMMT, 2024).
Although these shifts are encouraging, in many cases, they remain fairly marginal and in a meta-assessment of CE strategies adopted across the motor vehicle industry, Prochatzki et al. (2023) found a primary focus continued to be on lower-value recycling alongside a more limited emphasis on enabling higher value-retention activities such as reuse. Growing demand in larger vehicle segments such as SUVs has worked against other drivers for vehicle lightweighting (Global Fuel Economy Initiative, 2023).[7] While the average number of miles driven in private vehicles has fallen in recent years, vehicle ownership rates are high and increasing in the UK, contributing to a high material throughput (DfT, 2023; ONS, 2023). In 2022 furthermore, car and van occupancy averaged around 1.5 people across all trip purposes and stood at as low as 1.1 people per vehicle for commuting (DfT, 2023).
Spotlight on product lifespan extension
Between 2014 and 2022, the average age of vehicles in the UK stock increased across all body types. For cars specifically, it increased from 8 to 10 years while the share of cars under the age of 10 years old fell from 71% to 62% (DfT, 2023).[8] Long-term increases in vehicle lifetimes on display have been aided by innovation in materials, more reliable components (particularly engines and transmissions) and new life-extending consumables such as synthetic oils (Xu and Gao 2019).[9] Predictive maintenance has helped (Campgemini, 2023). The replacement of durables such as motor vehicles also tends to fall during periods of slower economic growth and reduced real household disposable incomes, with the high cost of new and used cars resulting from COVID-19 supply chain shocks having likely contributed to people holding onto vehicles longer in more recent years (RAC, 2023).
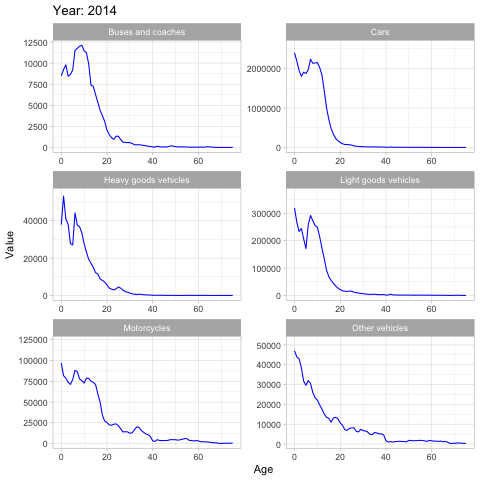
Figure 8. Number of Licenced and SORNd UK vehicle by age (in relation to year of manufacture) 2014-22 (DfT, 2023)
Lengthening the period of time that materials, components and products are used in the economy is frequently the most effective way to reduce total lifecycle environmental impacts (Box, 1983; Veolia, 2020). This benefit can result from the displacement of primary extraction and production-related impacts associated with new purchases and avoided end-of-life impacts. What role for PLE in motor vehicles specifically? Assuming no modal changes, the benefits of PLE in motor vehicles are conditional on factors that include the balance of impacts between the production, end-of-life and use-phases of different product generations as well as rates of improvement in these, the displacement effects of PLE on new purchases and use patterns more widely. This implies the need to think in terms of ‘optimal’ replacement moments.
A large share of lifecycle environmental impacts for vehicles occur at the use phase (Defra, 2023). Given relatively shallow historic improvements in fuel efficiency between generations, PLE of ICEVs has often been found to be better than replacement with another ICEV or even a hybrid in terms of emissions (Kagawa et al. 2011). PLE of fuel-efficient ICEVs can under some uses cases and assumptions around energy supply, decarbonisation and the battery size of BEVs, continue to have a place within current carbon budgets (Reuters, 2021; Nakamoto and Kagawa, 2021). The significant order of magnitude in reductions of use-phase emissions associated with a shift to low-emissions drivetrain technologies nevertheless means that where an ICEV is going to be replaced, it is better for it to be an zero-emissions vehicle under nearly all conditions from an emissions standpoint (Palstev, 2022).[10] Following a shift to zero-emissions vehicles, relatively high manufacturing emissions for BEVs and shallower improvements in use-phase impacts between generations again make PLE again a preferred option (Hertwich et al. 2019).
From an economic standpoint, PLE and any associated delayed product replacement might be expected to decrease expenditure on vehicles, thereby lowering sales and revenue for producers and other industries along the upstream value chain. Though potentially benefitting UK balance of payments given high import rates in motor vehicles (Cambridge Econometrics, 2022), products with longer lifespans can nevertheless also be sold at higher prices under different pricing and business models or alongside ancillary goods and services such that there is no noticeable effect on the scale of final demand in monetary terms (McCarthy, Dellink and Bibas, 2018; Aguilla-Hernendez et al. 2018; Donati et al. 2020). A move towards longer vehicle lifetimes can also bring with it a structural shift in the domestic economy due to the potential for increased spending on services such as maintenance and repair (Norman et al. 2021). For households, any savings from avoided replacement can also bring economic benefit, though with reliability remaining a critical issue.
Figure 9. Approximate GVA (aGVA) for relevant value chain activities in the Annual Business Survey at 3-digit SIC code detail (Billion GBP, current prices) (ONS, 2023)
Regarding its relevance in relation to other CE strategies, lifetime optimisation was highlighted by Accenture (in WEF, 2020) as a core transformation pathway for the motor vehicle industry to reduce carbon intensity and improve resource efficiency alongside product decarbonisation, greater material circularity and improved utilisation – all within a balance approach. Of these, use intensification (i.e. increasing the time a product is actually used in the economy) presents an addition consumption-related avenue to reduce lifecycle environmental impacts associated with vehicles (Kolleck, 2021) and greater durability can further support this (Morfeldt and Johansson, 2022). It is estimated that if 50% of drivers adopted ridesharing, there could be a 20% reduction in the number of vehicles on the road and associated reduction in materials used (Office of Chief Scientist, 2017; WRAP, 2022). Reducing car travel altogether can also generate a number of environmental and health benefits, lessen congestion and save UK residents money depending on which alternative are taken up (Grabow, 2011; Cycle Scheme, 2017). It is therefore important to contextualise this within the wider sustainable mobility hierarchy, which places walking and wheeling, cycling and public transport standing above the use of private transport (NHS, 2023).
Enablers of product lifetime extension in vehicles
Several key enablers which can help realise the benefits of PLE in motor vehicles here in the UK are:
- Design – The number one cited reason for changing cars in a 2022 UK survey was technical faults (81%) (4x4i, 2022). Upstream design and material choices by OEMs define the technical lifetime of new products or parts placed on the market through affecting durability, costs of repairs, modularity and upgradeability (Mesa et al. 2022; Lilley et al. 2020). As use-phase measures often rely on changes as far back as the product development phase, this further increases the necessity of a full value chain approach to minimise barriers and maximise benefits.
- Business models – The PLE business model focuses on lengthening the time period that a product can be used before disposing of it. Where PLE is being explored by vehicle manufacturers, identifying ways to more broadly leverage this strategy should be a focus given high embodied value and impacts (DESNZ, 2023). Some OEM and aftermarket activities such as repair, remanufacture and recycling further support lifetime extension at the level of components and materials while new business models such as selling components as a service alongside refurbishment have the potential to further increase resource efficiency (WEF, 2020; Wrålsen et al. 2021). Innovative business models to further increase the value extracted from products before they are discarded should be explored.
- Purchasing and use practices – PLE relies on consumer behaviour in a number of ways, including good driving practices, undertaking required maintenance and forestalling replacement. Wider changes in ownership practices could also further improve the sustainability of mobility and these are reportedly changing in the UK (YouGov, 2021).
- Policy – Government across the UK are setting out strategies, introducing regulations and building networks to deliver CE changes in focus areas. In the area of vehicles, reforms to EPR regulations are planned alongside an expansion to tyres, new batteries regulations and a raft of interventions to increase the uptake of low-emissions vehicles such as ending the sale of new petrol and diesel cars and vans from 2030 (Soo et al. 2021). How UK policy can further leverage the design, business model and purchasing use practices needed to extend the lifespan of vehicles should be explored further. A 2022 study by Wrap and Leeds University found that ecodesign standards to increase the use of aluminium in vehicles, consumer information on vehicles, encouraging the increased uptake of car sharing initiatives and EPR on vehicles and tyres (alongside support for electric arc furnaces) could contribute to an against-baseline reduction in the national material and carbon footprint between 2021-50 as well as UK territorial emissions. A parallel study assessing the effects of this same group of policies on the economy found these could simultaneously generate a net positive economic impact (Cambridge Econometrics, 2022).
Unlocking the value of data to deliver a UK circular economy
The DESNZ series of reports ‘Unlocking Resource Efficiency’ recommends tracking progress in resource efficiency for the motor vehicles sector using metrics which include average product weight, rates of recycled content having displaced virgin material and the percentage of cars within sharing schemes (DESNZ, 2023). Vehicles are one product group for which publicly available data can already be used to help build up a relatively complete picture of product and material flows, stocks, usage, monetary values and environmental impacts (Figure 10) in line with such circular economy indicators (Lysaght et al. 2022).
As part of the NICER programme, the CE-Hub has been engaging with data providers in the area of vehicles and has been applying innovative data science techniques to link official and emerging sources to generate further insights such as on the flows of materials associated with product sales and stocks. We have also been busy tapping emerging sources such as online marketplaces to get a better picture of CE activities otherwise obscured or excluded from official data sources and explore the potential to populate metrics such as value retention.
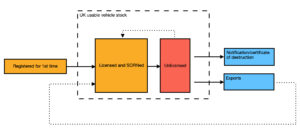
Figure 10. Data on the vehicle value chain published (yellow) and estimated (red) by the Department for Transport as well as collected by the DVLA (blue)
As part of developing the UK’s first national CE Data Observatory, the CE-Hub and partners across NICER are bringing data together across a range of key resource and product flows. Intended to help tackle information gaps, facilitate improved monitoring and provide a strengthened basis for opportunity scanning of CE transition pathways as part of building a more circular, resource-efficient and productive UK economy, the UK CE Data Observatory will be launched in 2024. More information on the CE Data Observatory can be found here.
**
If you’d like to discuss the ‘Extending Product Lifespans’ series further or find out about current projects and forthcoming outputs from the CE-Hub, please contact us at ce_hub@exeter.ac.uk.
Lead author: Oliver Lysaght.
With contributions from Peter Hopkinson, Markus Zils, Esmaeil Khedmati Morasae and Ryan Nolan.
Endnotes
[1] The 2023 ‘zero emissions vehicle mandate’ proposes that 100% of new cars and vans sold in Great Britain are zero emission by 2035 (DfT, 2023).
[2] To a total of £2.121 billion per week nationally or £74.40 per household per week on average.
[3] the remainder was associated with transport services which includes car leasing as its largest sub-category.
[4] With this figure estimated to be around 1.5-2 million tonnes in a given year.
[5] DESNZ figures (variable 1-8) account on a ‘territorial’ basis and ONS, on a ‘residency’ basis.
[6] ‘Wholesale and retail trade and repair services of motor vehicles and motorcycles’ covers SIC 45-47, while around half of UK aGVA for ‘Rental and leasing services’ (SIC 77) (47% in 2021) was associated with ‘Renting and leasing of motor vehicles’ or approximately a quarter of the number of enterprises (ONS, 2023).
[7] The mass of a new car rolling off domestic and overseas production floors for UK consumers can vary greatly, even within the same drivetrain type. For example the ‘curb weight’ of EVs (to be) available in the UK and tracked by EV Specifications, range from less than one tonne (970kg) for a Dacia Spring to almost three tonnes for a 2024 Volvo EX90 Twin Motor.
[8] While already informative and often used as a basis to estimate lifespan distributions (Oguchi and Fuse (2015; Held et al. 2021), these data do not show us the age at which vehicles are disposed of. Though the DVLA does not appear to collect data on the age of vehicles at time of scrappage, several studies suggest this is increasing too. Survival rate analysis in 2008 of originally registered vehicles in the UK still on the road indicates that the number of vehicles scrapped in the first 9 years of their life was small, that 50% of cars were still on the road by 14 years and by the 20th year, more than 95% of cars in a given cohort have been scrapped (RAC, 2008).
[9] The assortment of components that cars are made up of also vary in their expected useful lifetime which in the majority of cases is shorter than that of a vehicle overall necessitating replacement as part of ongoing maintenance. For example, in ICEVs, oil and oil filters are often recommended to be replaced every 5-10,000 miles while for batteries, brake fluid and brake pads, this is every 20-50,000 miles. Components such as transmissions on the other hand can last over 100,000 miles. Due to their reduced product complexity, several studies suggest that BEVs may last longer than ICEs, though definitive survival curves remains difficult to estimate at this time given the relatively recent appearance of the technology (Greene and Leard, 2022).
[10] High upfront costs of zero emissions vehicles remain a barrier to their wider uptake despite studies indicating they are now cheaper on average than ICEs on a per-year basis (uSwitch, 2023; Gössling et al. 2022).