CE-Hub, 2023
Circular Economy Roadmap Dashboard
CE-Hub, 2023
Welcome to the Global Circular Economy Roadmap Dashboard.
The Dashboard provides an expansive view of global CE roadmapping activities. It maps out the core features of the roadmaps that various countries and cities have developed. These core features were extracted and integrated into dashboard variables through the use of a natural language processing.
Users can explore specific aspects of roadmaps, such as the types of roadmaps, motivations, and the key priority areas set by various countries. The Dashboard also incorporates certain performance metrics such as, material productivity, and domestic material consumption, drawn from global sources and agencies, including the OECD, the World Bank and the FAO. This tool aims to provide insight into the prevailing dynamics and future course of global CE roadmapping.
The development of this dashboard is ongoing and any comments or feedback is much appreciated. Please direct inquiries to ce_hub@exeter.ac.uk. Further description of attributes and variables can be downloaded in the PDF below.
Dashboard Highlights:
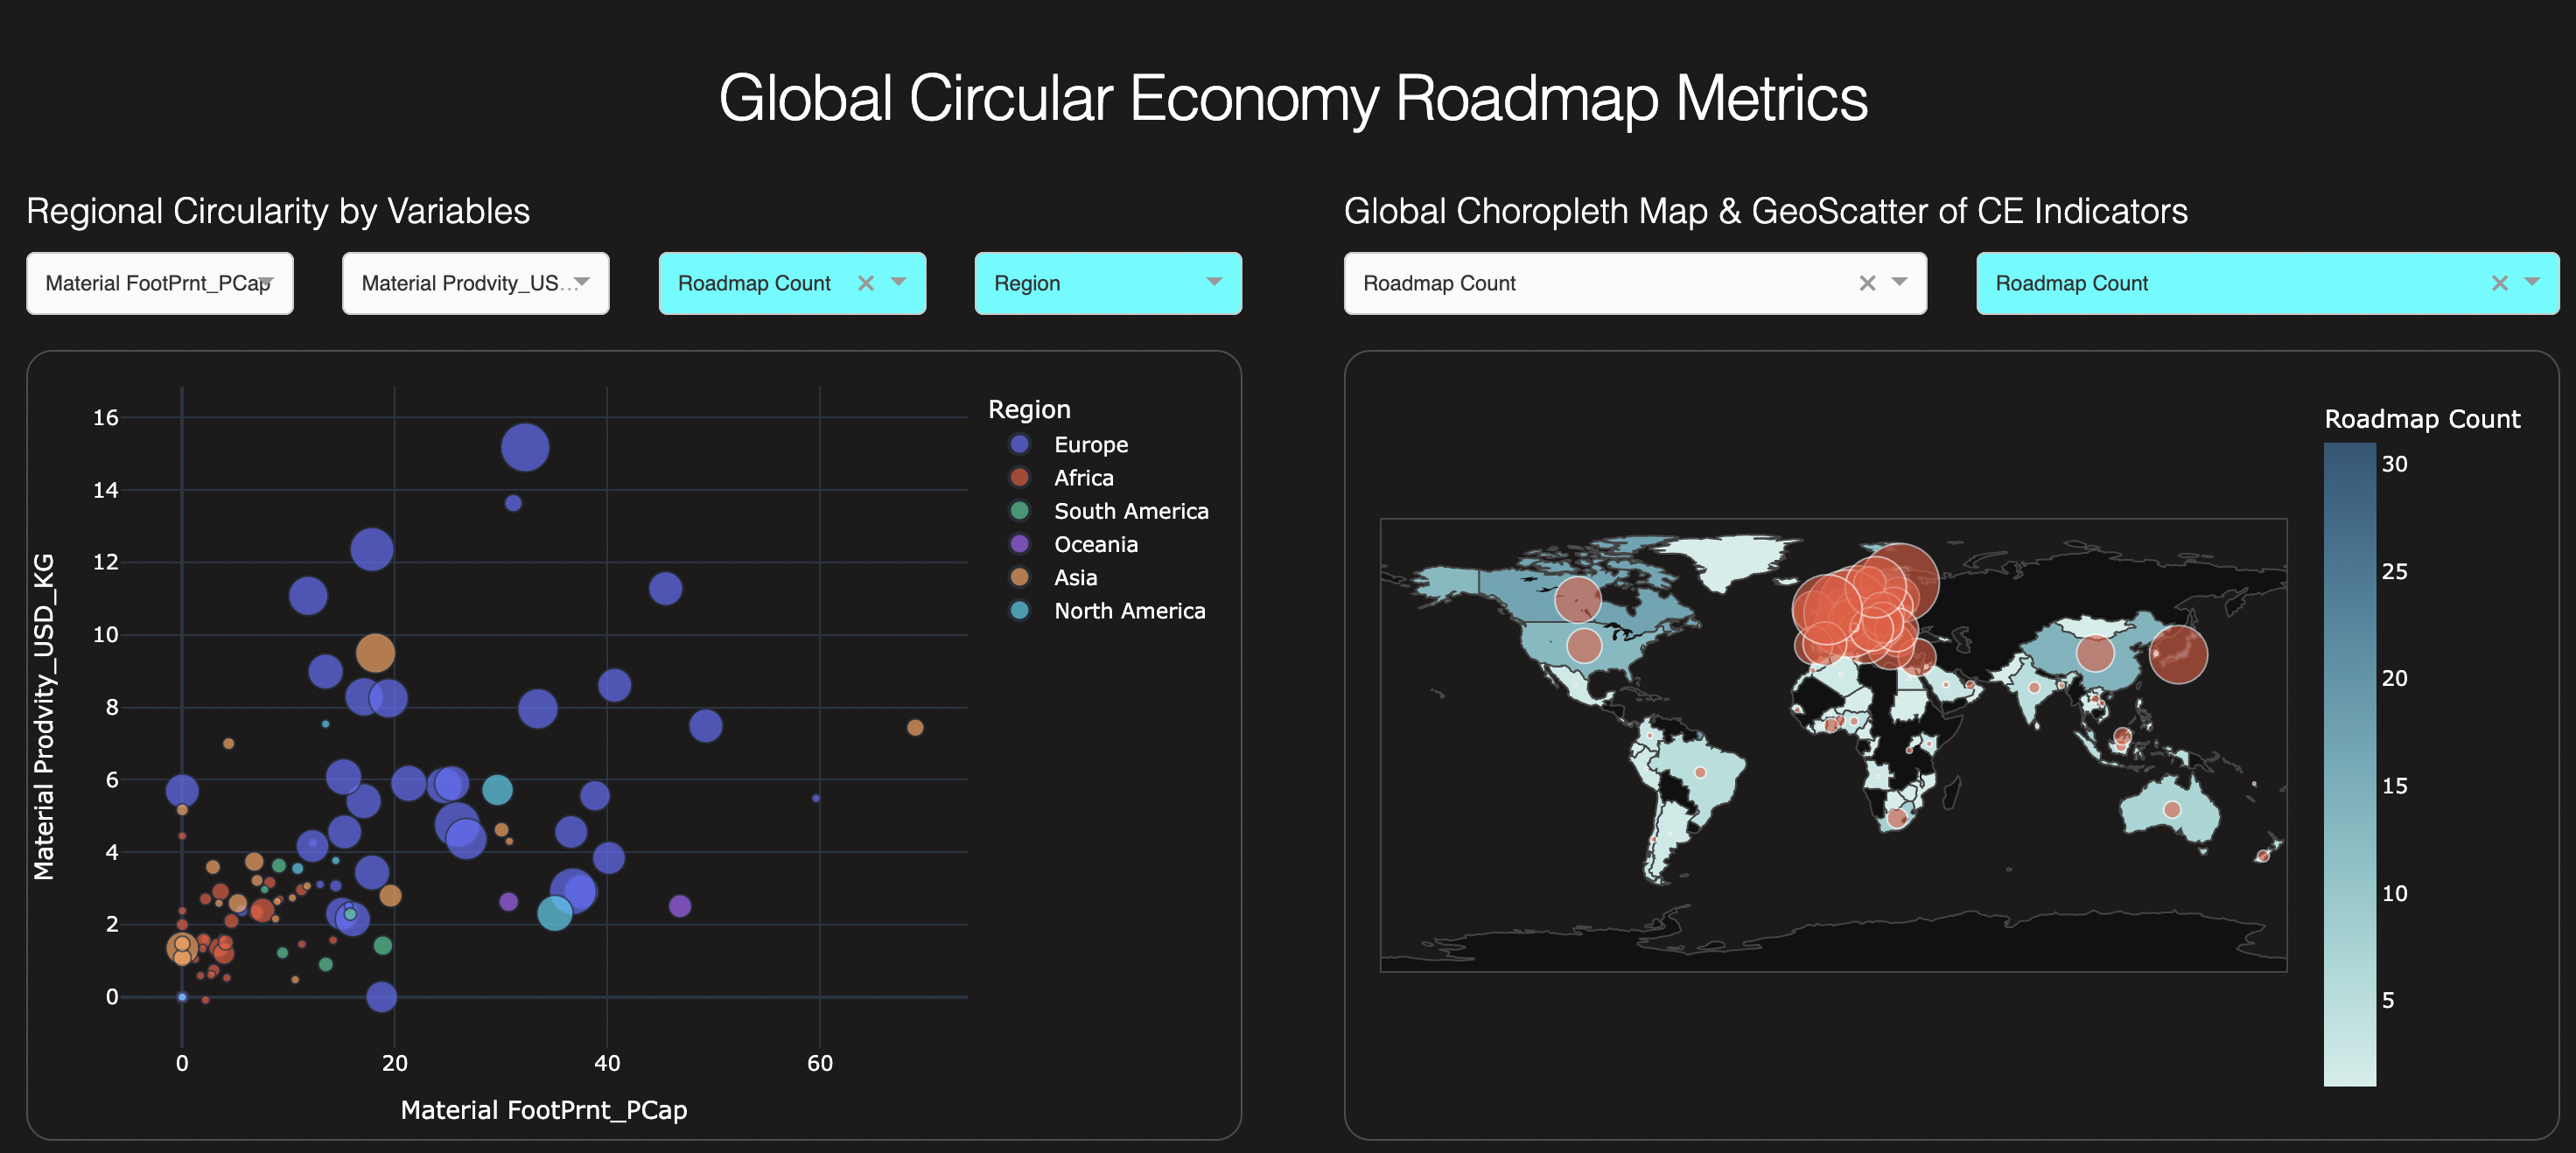
- Regional Circularity by Variables (Plot 1):
- Interactive scatter plot for visualising regional roadmapping efforts.
- Compare regional metrics such as Material Footprint Per Capita and domestic material and mismanaged plastic waste.
- Compare the distribution of roadmap counts, priority areas and CE policies across regions.
- Global Choropleth & GeoScatter of CE Indicators (Plot 2):
- Visualise global CE roadmapping efforts and the geographical prominence of useful metrics.
- Use map colours to depict roadmapping variables, with bubble sizes emphasising the scale of particular CE metrics.
- Circular Economy Roadmap Attributes By Country (Plot 3):
- Access country-specific roadmapping statistics through pie chart representations.
- Determine the primary areas of emphasis for countries.
- Circular Economy Roadmap Attributes By Typology (Plot 4):
- Use A treemap view of the proportions of different types of roadmaps by country, priority areas and motivations.
- 20-Country Comparison of Roadmap Attributes (Plot 5):
- Stack bar charts allow multi-country comparison across roadmap attributes.
- Roadmap Priority Areas by Location (Plot 6):
- Treemap analysis of the focal areas highlighted by different geographical scales.
- Global Food Loss Value Chain Stages (Plot 7):
- Highlight the stages of the food value chain prone to waste or loss.
CERM Dashboard Variable and Attribute Definitions
View resourceRelated Resources

NICER Case Study: Steel Circularity Roadmap
Centre for Circular Metals, 2022